


Need To Know How many Business started In The USA In 2026 - Get US Business Formation Statistics
How many new businesses started in the United States in 2026? This page tracks monthly U.S. Business Applications and Projected Business Formations using data from the U.S. Census Bureau’s Business Formation Statistics (BFS) program. It is updated within a day of each monthly release.
Note on terminology: A Business Application is not the same as a new operating business. See the section below on “Business Applications vs. Business Formations” before using or citing these numbers.
If you’re planning to become part of the growing number of businesses being started in the U.S., US Global Startup can help you with LLC Registration in USA and Federal Tax Filing.
US Business Formation Statistics: August 2026 Latest Data
| Metric | August 2026 | Change vs. July 2026 |
|---|---|---|
| Business Applications (Total) | 531,728 | -7.8% |
| High-Propensity Business Applications (HBA) | 145,387 | -4.1% |
| Business Applications with Planned Wages (WBA) | 34,263 | -1.9% |
| Business Applications from Corporations (CBA) | 41,075 | -8.1% |
| Projected Business Formations within 4 Quarters | 28,501 | -4.6% |
| Projected Business Formations within 8 Quarters | 39,292 | -3.4% |
Source: U.S. Census Bureau, Business Formation Statistics, August 2026 release, published September 11, 2026. All figures are seasonally adjusted.
Business applications fell in August 2026 after a strong July, decreasing 7.8% to 531,728. This type of monthly change is common in business formation data. A strong increase in one month can be followed by a partial decrease the next month.
High-propensity applications, which are more likely to become actual employer businesses, fell by 4.1%. Projected business formations within four quarters, which estimate new employer startups, decreased 4.6% to 28,501.
Overall, the August 2026 data shows monthly changes in U.S. business formation activity rather than a clear long-term trend.
USA Business Applications by Month 2026: Monthly Business Formation Data & Trends
Wondering how many new businesses started in the US in 2026? The table below shows the number of new business applications received each month in 2026.
| Month | Business Applications | MoM Change | Projected Formations (4 Qtrs) | MoM Change |
|---|---|---|---|---|
| January 2026 | 532,319 | +7.2% | 29,863 | +4.5% |
| February 2026 | 496,443 | -5.8% | 28,994 | -3.2% |
| March 2026 | 491,941 | -0.9% | 28,980 | -0.2% |
| April 2026 | 503,171 | +2.1% | 28,479 | -1.6% |
| May 2026 | 523,971 | +3.7% | 29,493 | +3.3% |
| June 2026 | 531,423 | +1.1% | 29,741 | +0.7% |
| July 2026 | 578,926 | +8.1% | 29,959 | +0.7% |
| August 2026 | 531,728 | -7.8% | 28,501 | 28,501 |
| September 2026 | Not Yet Released | Not Yet Released | Not Yet Released | Not Yet Released |
| October 2026 | Not yet Released | Not yet Released | Not yet Released | Not yet Released |
| November 2026 | Not Yet Released | Not Yet Released | Not Yet Released | Not Yet Released |
| December 2026 | Not Yet Released | Not Yet Released | Not Yet Released | Not Yet Released |
The monthly figures provide a clear view of the number of new businesses in the US in 2026 and how business formation has changed throughout the year.
- 026 YTD (January To August) Business Applications: 4,189,922
- 2026 YTD (January To August) Projected Business Formations (4 Qtrs): 234,010
Data source for each month: U.S. Census Bureau Business Formation Statistics historical releases. September 2026 data is scheduled for release October 14, 2026.
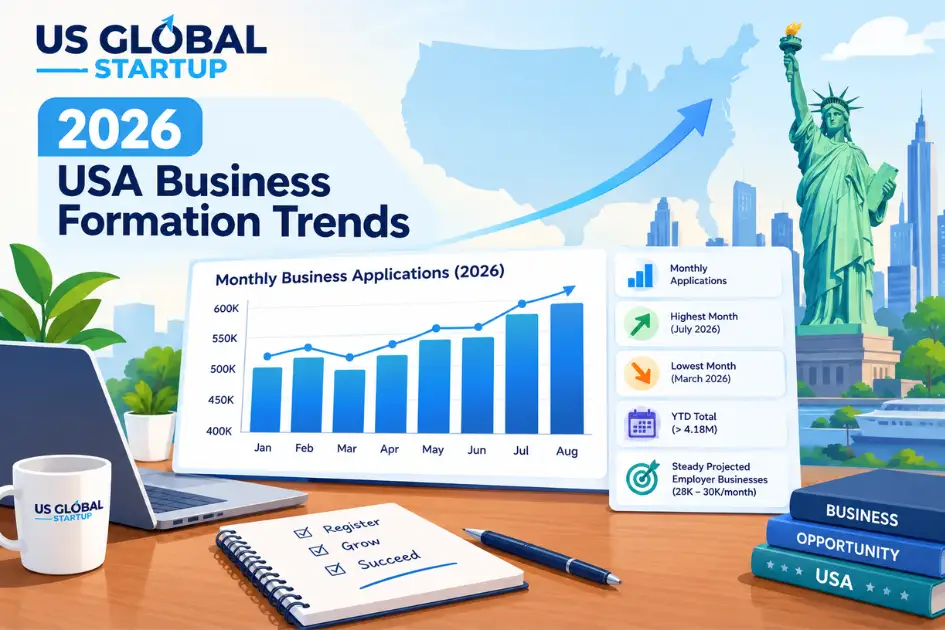
2026 USA Business Formation Trends
- Monthly business applications In 2026: New business applications by month have stayed roughly between 490,000 and 580,000.
- Highest month so far: July 2026 recorded the highest number of business applications at 578,926.
- Lowest month so far: March 2026 recorded the lowest number at 491,941.
- Compared with the pandemic period: The monthly range in 2026 is tighter than the large swings seen during the 2020 – 2021 period.
- 2026 YTD total: From January through August, the U.S. recorded more than 4.18 million business applications.
- Projected business formations: The number of applications expected to become actual employer businesses within four quarters has stayed in a relatively narrow range of about 28,000 – 30,000 per month.
- Overall trend: Business application numbers have changed from month to month, while the projected number of new employer businesses has remained more stable
US business registration statistics show the continued interest in business formation rate in the America. Hence starting a business in the U.S. begins with the right setup. US Global Startup provides professional Company Registration in USA to help you establish your business with confidence.
US Business Applications by Type 2026: Detailed Business Formation Statistics
These new business statistics of 2026 show the monthly number of business applications by type, including HBA, CBA, and WBA.
| Month | Total (BA) | High-Propensity (HBA) | With Planned Wages (WBA) | From Corporations (CBA) |
|---|---|---|---|---|
| January 2026 | 532,319 | 147,516 | 39,191 | 44,245 |
| February 2026 | 496,443 | 145,918 | 38,235 | 41,552 |
| March 2026 | 491,941 | 144,952 | 36,647 | 40,912 |
| April 2026 | 503,171 | 146,782 | 35,775 | 41,691 |
| May 2026 | 523,971 | 146,555 | 35,599 | 40,994 |
| June 2026 | 531,423 | 149,714 | 35,695 | 43,346 |
| July 2026 | 578,926 | 151,857 | 35,024 | 44,738 |
| August 2026 | 531,728 | 145,387 | 34,263 | 41,075 |
| September 2026 | Not Yet Released | Not Yet Released | Not Yet Released | Not Yet Released |
| October 2026 | Not yet Released | Not yet Released | Not yet Released | Not yet Released |
| November 2026 | Not Yet Released | Not Yet Released | Not Yet Released | Not Yet Released |
| December 2026 | Not Yet Released | Not Yet Released | Not Yet Released | Not Yet Released |
Source: U.S. Census Bureau, Business Formation Statistics, monthly releases January-August 2026.
What Are The Key Trends in US Business Applications in 2026?
- High-Propensity Business Applications (HBA): HBA stayed fairly steady throughout 2026, ranging from about 145,000 to 152,000 each month.
- Total Business Applications (BA): Total applications changed more significantly, with nearly 90,000 applications between the lowest and highest months.
- Planned Wage Applications (WBA): WBA gradually decreased from 39,191 in January to 34,263 in August.
- Corporation Applications (CBA): CBA remained relatively close to its starting level, increased in June and July, and then decreased in August.
- Understanding the numbers: HBA, WBA, and CBA can provide additional information about business activity beyond the total number of business applications.
Census Bureau Notice: As of the January 2026 release, HBA and CBA definitions exclude applications connected to internet sales. The BFS time series was also updated to use 2022 NAICS codes during the annual update on February 11, 2026. Pre-2026 HBA and CBA figures may not be directly comparable with 2026 figures without adjustment.
Business Applications vs. Business Formations
Business Applications and Business Formations are not the same thing.
Business Applications
It is based on applications for an Employer Identification Number (EIN) through IRS Form SS-4. The Census Bureau’s BFS excludes certain applications, such as tax liens, estates and trusts, applications with no state-county geocode, low-transition-rate NAICS codes in agriculture and public administration, and a few other categories.
Need an EIN for your business? US Global Startup can help you to apply for your EIN online.
Business Formations
Census identifies an employer business formation based on the first appearance of payroll tax liability connected to that application.
For example, 531,728 business applications in August 2026 does not mean 531,728 new operating businesses. Some applications may never generate payroll or become an employer business. This is why the Census Bureau reports these numbers separately.
What Is a Projected Business Formation?
The Census Bureau reports Projected Business Formations within 4 Quarters (PBF4Q). This is an estimate of how many employer businesses are expected to form within four quarters (12 months) of a given month’s applications. It does not mean that these businesses started operating during that same month.
August 2026 Example
- 531,728 business applications were filed.
- 28,501 of those applications were projected to become employer businesses within four quarters.
2026 vs 2025 US Business Applications: Year over Year Comparison
| Month | 2025 Business Applications | 2026 Business Applications | YoY Change |
|---|---|---|---|
| April | 451,009 | 503,171 | +11.6% |
| May | 449,117 | 523,971 | +16.7% |
| June | 459,675 | 531,423 | +15.6% |
| July | 472,000 | 578,926 | +22.7% |
| August | 476,740 | 531,728 | +11.5% |
Source: U.S. Census Bureau, Business Formation Statistics (seasonally adjusted monthly series). Figures reflect the most recently revised vintage; individual monthly totals can be revised during the annual update each January.
Quarterly average comparison:
| Quarter | 2025 Avg. Monthly Applications | 2026 Avg. Monthly Applications | YoY Change |
|---|---|---|---|
| Q1 | 425,788 | 506,901 | +19.1% |
| Q2 | 457,215 | 519,522 | +13.6% |
| Q3 (partial - July To August only) | 487,900 (full quarter) | 555,327 (July to August avg) | Pending September data |
Key Points from the 2026 vs 2025 Data
- April 2026: Business applications increased by 11.6% compared with April 2025.
- May 2026: Applications increased by 16.7% year over year.
- June 2026: Applications increased by 15.6% compared with June 2025.
- July 2026: Applications increased by 22.7%, the largest increase in this comparison.
- August 2026: Applications were 11.5% higher than August 2025.
- Q1 2026: The average monthly applications were 19.1% higher than Q1 2025.
- Q2 2026: The average monthly applications were 13.6% higher than Q2 2025.
- Q3 2026: The comparison is still incomplete because September 2026 data has not been released.
The available 2026 data shows that monthly U.S. business applications were higher than the same months in 2025. The full-year 2026 trend will become clearer after the remaining monthly data is released.
Note: The Census Bureau’s economic indicator release calendar had disruptions during the 2025 federal funding lapse, and no BFS reports were issued for September or October 2025. Some 2025 monthly comparisons therefore use figures released later.
US Business Applications by Year: 2022 - 2026 Comparison
| Year | Total Business Applications | Change |
|---|---|---|
| 2022 | 5,083,802 | - |
| 2023 | 5,489,174 | +8.0% |
| 2024 | 5,246,630 | -4.4% |
| 2025 | 5,644,240 | +7.6% |
| 2026 YTD (through August) | 4,189,922 | Not a full-year total |
Source: U.S. Census Bureau, Business Formation Statistics, annual series (seasonally adjusted, summed). The 2026 YTD figure should not be compared directly with the full-year totals above.
US Business Formation Trends Since 2022
- 2022: The U.S. recorded 5.08 million business applications.
- 2023: Applications increased to 5.49 million, an 8.0% increase.
- 2024: Applications decreased to 5.25 million, a 4.4% decrease.
- 2025: Applications increased again to 5.64 million, the highest full-year total in this four-year period.
- 2026 YTD: Through August 2026, the U.S. has recorded 4.19 million business applications.
- Important: The 2026 figure covers only January through August, so it is not a full-year total.
Looking at the yearly numbers gives a clearer view of U.S. business formation trends. Monthly numbers can change from one month to another, while yearly totals show the broader pattern of business applications over time.
US Business Applications by Region 2026: Regional Business Formation Statistics
| Month | Northeast | Midwest | South | West |
|---|---|---|---|---|
| January 2026 | 72,820 | 92,521 | 235,572 | 131,406 |
| February 2026 | 70,265 | 81,619 | 222,758 | 121,801 |
| March 2026 | 69,711 | 80,769 | 221,542 | 119,919 |
| April 2026 | 72,752 | 81,984 | 225,003 | 123,432 |
| May 2026 | 74,101 | 85,537 | 235,550 | 128,783 |
| June 2026 | 74,558 | 88,533 | 236,198 | 132,134 |
| July 2026 | 78,549 | 100,780 | 257,650 | 141,947 |
| August 2026 | 74,664 | 91,773 | 232,595 | 132,696 |
Source: U.S. Census Bureau, Business Formation Statistics, “Business Applications – At a Glance” tables, monthly releases January – August 2026. Regions are defined by the Census Bureau Geography Program.
Key Regional Business Application Trends in 2026
- South: The South recorded the highest number of business applications throughout the year, accounting for roughly 44 – 45% of national applications in most months.
- Northeast: Applications remained relatively steady, ranging from 69,711 in March to 78,549 in July.
- Midwest: The Midwest saw a large increase in July, rising from 88,533 in June to 100,780 in July, before falling to 91,773 in August.
- West: Applications increased from 119,919 in March to a 2026 high of 141,947 in July, before decreasing slightly in August.
- July 2026: All four regions recorded higher business applications compared with June, matching the increase seen in the national business application data.
- August 2026: Applications decreased across all four regions following the strong July increase.
Overall, the 2026 data shows that business applications have remained active across all major U.S. regions, with the South recording the largest number of applications each month so far.
U.S. Business Applications by Industry 2026: August Business Formation Statistics
| NAICS Sector | Applications | MoM Change |
|---|---|---|
| 44 - 45: Retail Trade | 104,087 | -26.0% |
| 54: Professional Services | 80,691 | -0.4% |
| 23: Construction | 48,120 | -1.4% |
| 81: Other Services | 43,221 | -2.4% |
| 56: Administrative and Support | 37,796 | +0.8% |
| 48 - 49: Transportation and Warehousing | 35,175 | +0.7% |
| 62: Health Care and Social Assistance | 32,522 | -3.8% |
| 72: Accommodation and Food Services | 26,892 | -10.6% |
| 53: Real Estate | 23,670 | -9.5% |
| 52: Finance and Insurance | 20,137 | -0.4% |
| Unclassified | 12,687 | -1.7% |
| 71: Arts and Entertainment | 15,191 | +1.0% |
| 51: Information | 13,180 | +0.3% |
| 42: Wholesale Trade | 9,998 | +2.6% |
| 61: Educational Services | 8,657 | +1.3% |
| 31 - 33: Manufacturing | 7,910 | +0.4% |
| 55: Management of Companies | 6,853 | +1.0% |
| 11: Agriculture | 3,859 | -2.5% |
| 21: Mining | 559 | +4.1% |
| 22: Utilities | 525 | -7.1% |
Source: U.S. Census Bureau, Business Formation Statistics, “Business Applications by Industry” table, August 2026 release. Data is adjusted for seasonality except Utilities (22).
Key U.S. Business Application Trends by Industry
- Retail Trade: Retail Trade recorded the highest number of applications in August, with 104,087 applications.
- Professional Services: Professional Services ranked second with 80,691 applications and remained almost unchanged from the previous month.
- Construction: Construction recorded 48,120 applications, making it one of the larger business application categories.
- Other Services: This sector recorded 43,221 applications in August.
- Administrative and Support: Applications increased slightly by 0.8%, reaching 37,796.
- Transportation and Warehousing: This sector recorded 35,175 applications, an increase of 0.7% from July.
- Health Care and Social Assistance: There were 32,522 applications, down 3.8% from the previous month.
- Accommodation and Food Services: Applications decreased by 10.6% to 26,892.
- Real Estate: Applications decreased by 9.5%, reaching 23,670.
- Smaller industries: Mining, Utilities, and Agriculture recorded fewer applications compared with the larger business sectors.
Overall, Retail Trade and Professional Services were the two largest categories for business applications in August 2026. The data also shows that business applications were spread across many different industries, including construction, healthcare, transportation, real estate, finance, and professional services.
What Is a Business Application? US Business Formation Definitions
- Business Applications (BA): The main series includes all EIN applications filed through IRS Form SS-4, excluding tax liens, estates and trusts, applications with no state-county geocode, low-transition NAICS codes in agriculture (11) and public administration (92), and some other exclusions.
- High-Propensity Business Applications (HBA): A group of BA applications that are more likely to become employer businesses.
- Business Applications with Planned Wages (WBA): HBA applications that include a planned date for paying wages for the first time.
- Business Applications from Corporations (CBA): HBA applications filed as a corporation or personal service corporation.
What Is a Business Formation?
- An employer business formation is identified by the first instance of payroll tax liability connected to an application.
- Business Formations within 4 Quarters (BF4Q): Actual business formations confirmed through administrative payroll data. This data is currently confirmed only through Q4 2023.
- Projected Business Formations within 4 Quarters (PBF4Q): A model-based estimate used for periods where actual data is not yet available, starting from January 2023 onward.
Methodology and Data Sources
This page uses Business Formation Statistics published monthly by the U.S. Census Bureau. The statistics are developed in collaboration with the Federal Reserve Board of Governors, the Federal Reserve Bank of Atlanta, the University of Maryland, and the University of Notre Dame.
The data is updated each year as new administrative payroll data and updated NAICS coding become available. The most recent annual update was applied with the January 2026 release on February 11, 2026.
Frequently Asked Questions About US Business Formation Statistics 2026
How many new businesses started in the USA in 2026?
Through August 2026, 4,189,922 business applications were filed across the US The Census Bureau projects that 234,010 of these applications will become actual employer businesses within four quarters, based on Census Bureau Business Formation Statistics.
How many business applications were filed in August 2026?
There were 531,728 business applications filed in August 2026, which was a 7.8% decrease from July 2026, when there were 578,926 applications.
What is the difference between a business application and a business formation?
A business application is an EIN filing through IRS Form SS-4. A business formation is confirmed when that entity generates its first payroll tax liability.
How does the Census Bureau measure new business activity?
The Census Bureau uses the Business Formation Statistics (BFS) program. It combines IRS EIN application data with administrative payroll records to measure business formation activity.
What is a projected business formation?
A projected business formation is a forward-looking Census Bureau estimate of how many applications from a given month are expected to become employer businesses within four or eight quarters.
Which region has the most business applications?
The South had the most business applications in August 2026, with 232,595 applications, which was roughly 44% of the national total.
Which industries have the most business applications?
In August 2026, Retail Trade had the most applications with 104,087, followed by Professional Services with 80,691 and Construction with 48,120.
How often is U.S. business formation data updated?
The data is updated monthly, usually about 11–12 days after the end of the reference month. September 2026 data is scheduled for release on October 14, 2026.